What Goes Into Lunch at Miquon?
A Whole Lot of Data
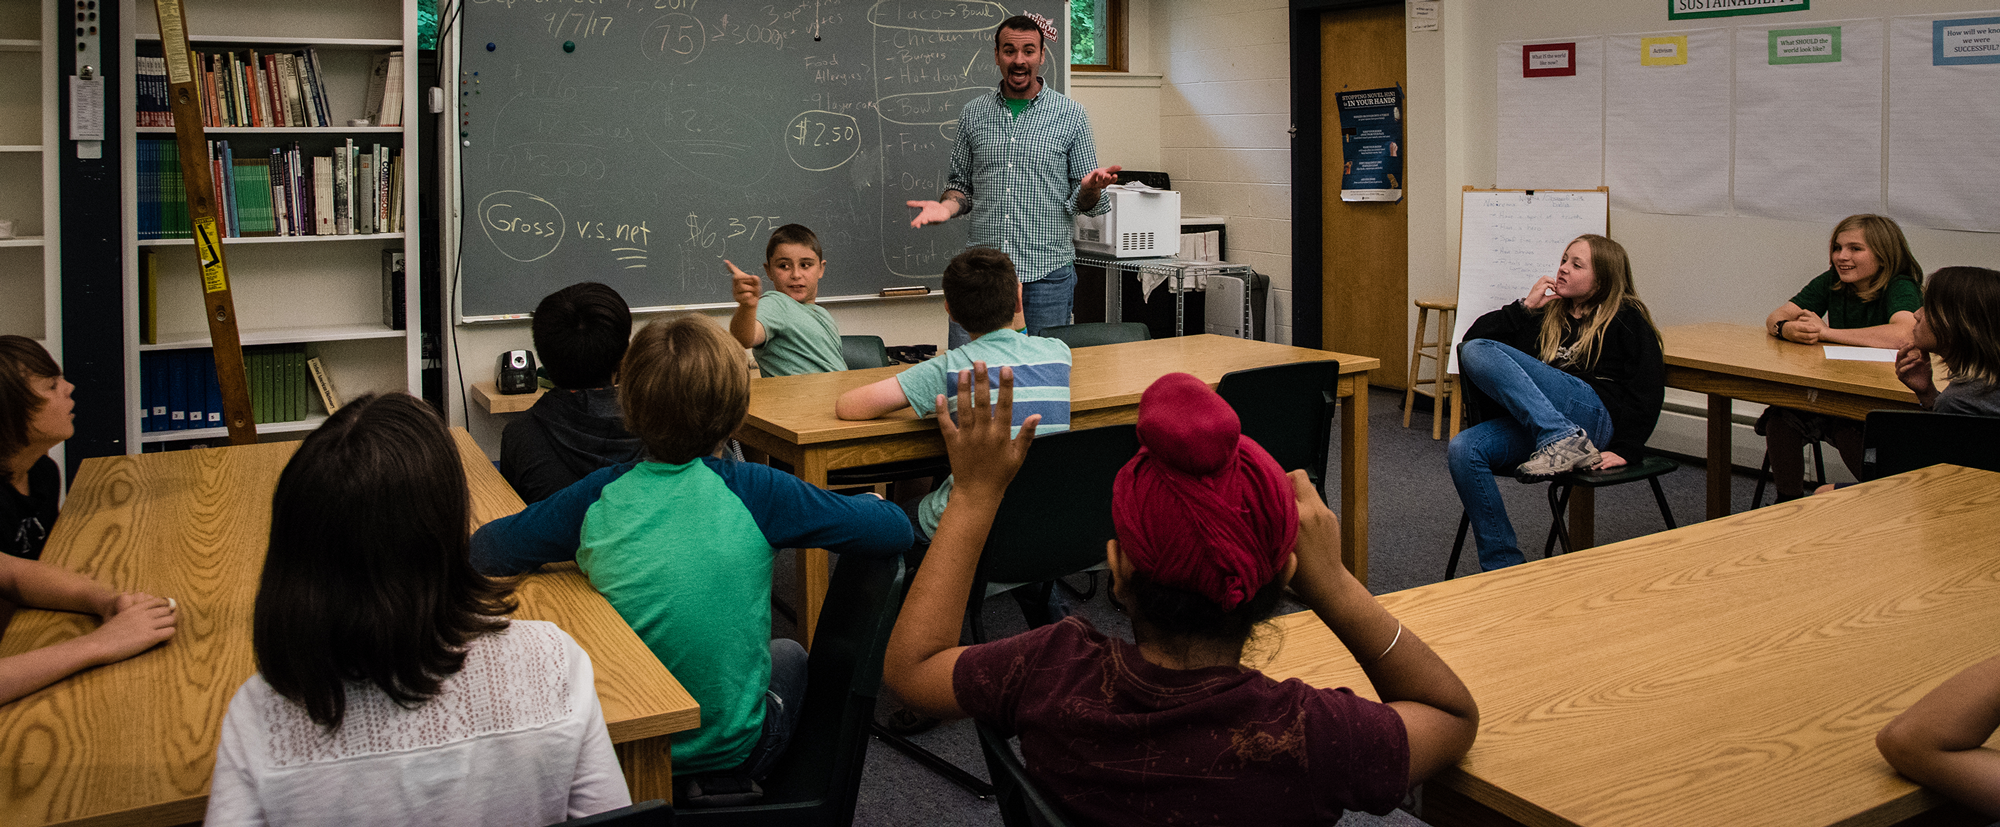
So what goes into a Miquon lunch? A lot of market research, leadership skills, data analysis and the development of some business acumen. Most importantly, the students learned a tremendous amount from this process and are walking away with many of the analytical skills needed to initiate a small sales enterprise.
The lunch sales that our classes create as a part of the ⅚ program represent a valuable service to the community, an authentic environment to practice real-world mathematical skills and also function as a fundraiser to pay for our end of the year trip. As a result of these goals, students in Louis and Jeri’s class have been hard at work envisioning a new lunch menu and completing calculations to estimate the net revenue we can expect to collect from these sales.
Constructivist Approach
In our class we take a constructivist approach to teaching and learning, meaning that we actively engage students in the learning design process and construction of knowledge. In that vein we began by providing the students with the opportunity to suggest menu items and provided them with certain practical limits such as, the meals need to be:
- easy to make and serve,
- the right mix of healthy and appealing to children
- the right cost to scale ratio to make enough money to pay for a trip
Over the course of the first week of class, students developed many exciting ideas such as burritos, mac and cheese, hummus and veggies, and more. However, through our discernment process the group was able to narrow down to several main options as well as a variety of sides.
Not wanting to make this decision alone, students wanted to get a sense of how students in the school would respond to the new menu choices. Additionally, they wanted to see what menu items appealed to younger vs. older students. Our students decided that they wanted to poll the other classrooms at Miquon and worked with Jeri to design a form. After getting all the data back from the various classrooms, students produced stacked bar graphs which allowed us to analyze both how individual grade bands felt about each menu item as well as project an estimate of what total sales could look like.
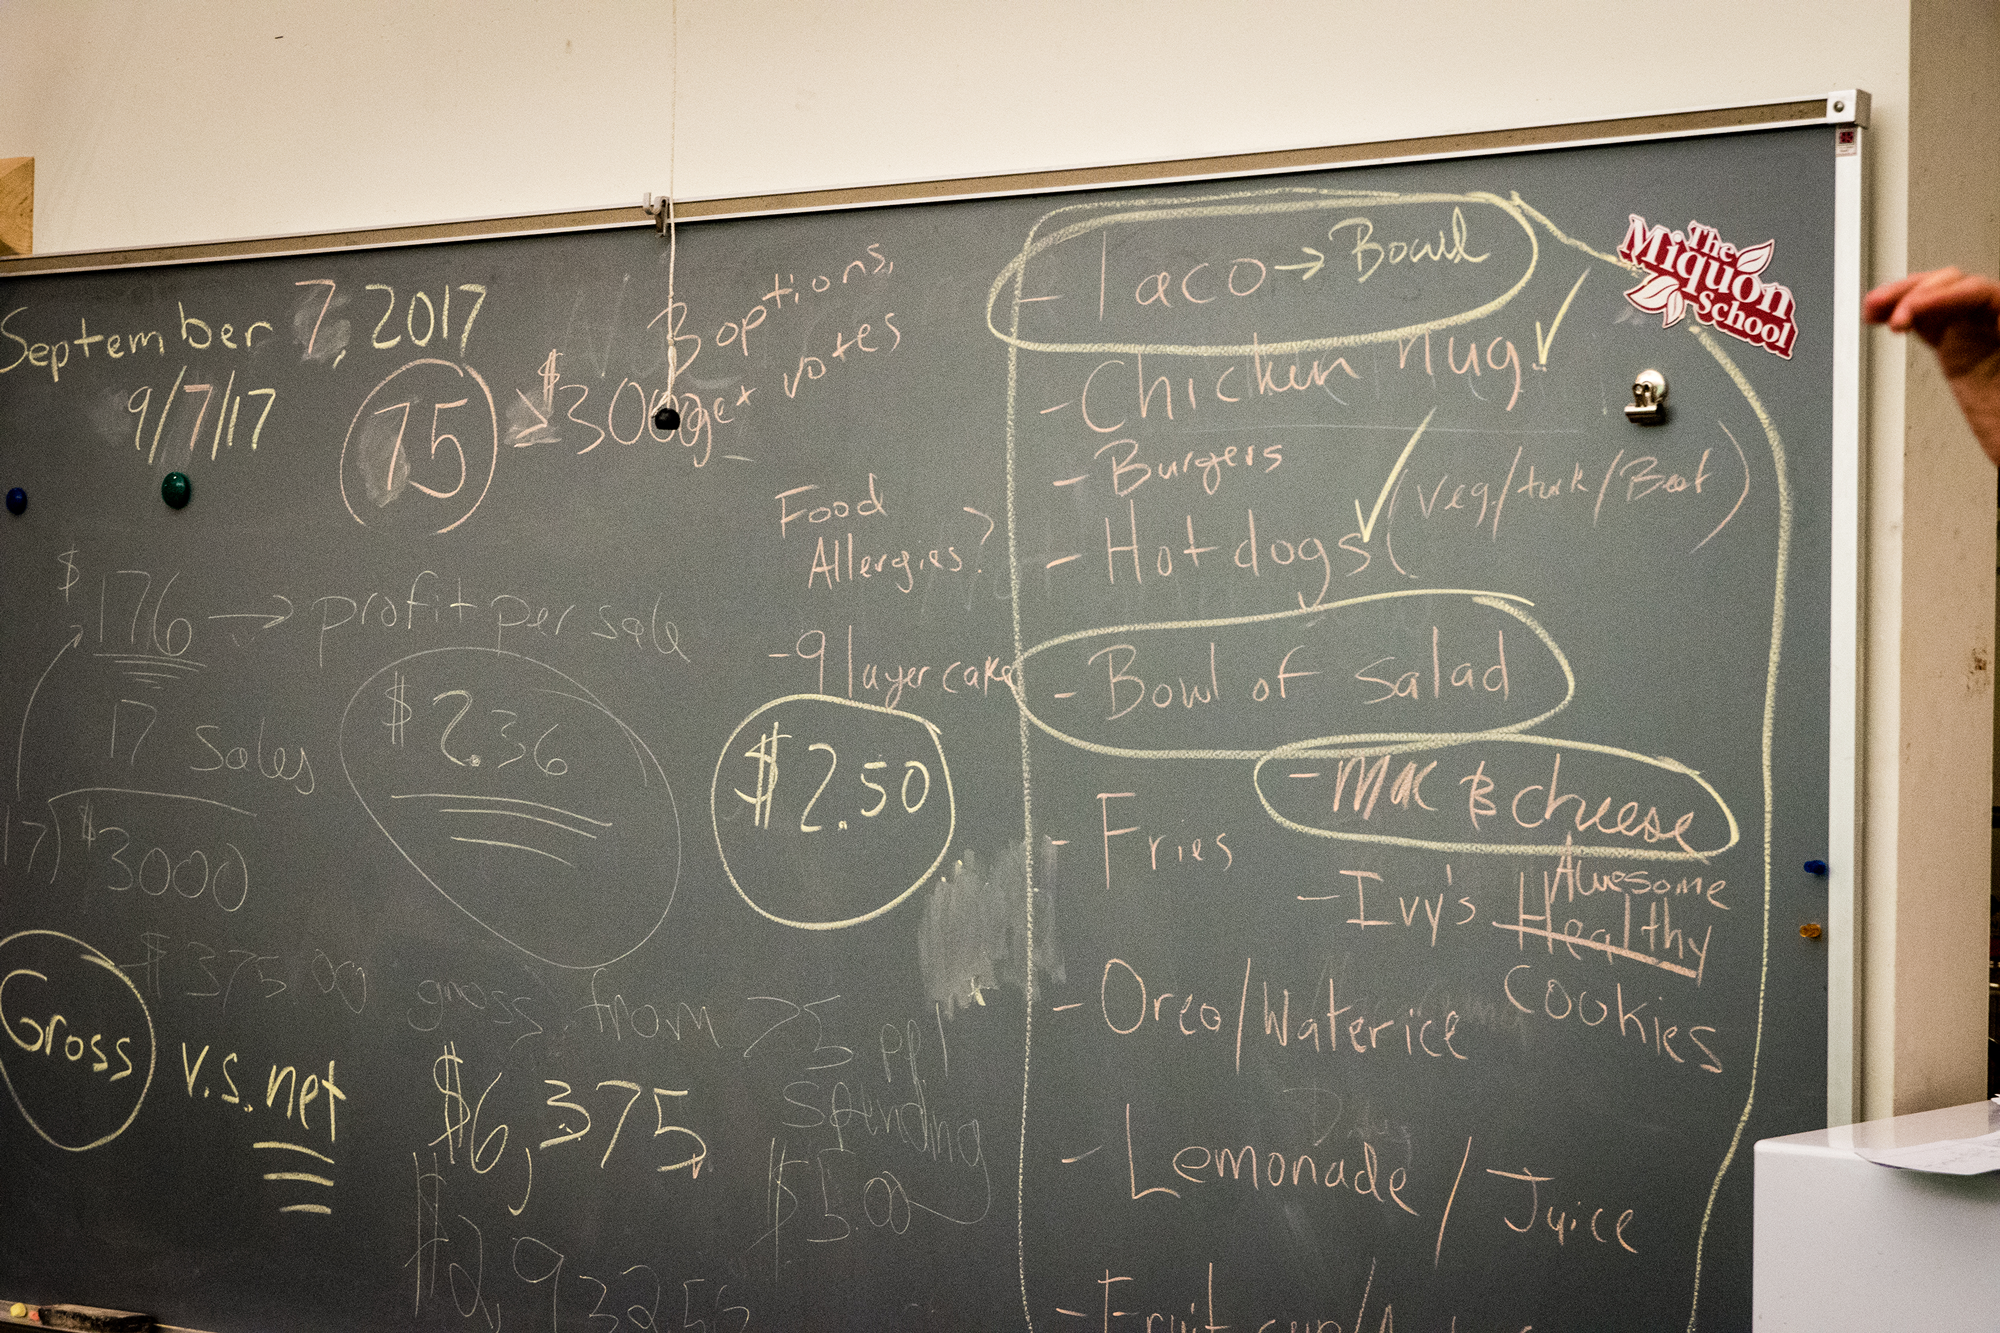
While students were completing this data analysis in class, at home they were calculating the cost of individual portion sizes for each meal. Using several supermarket circulars as well as websites that compare shopping prices, student’s recorded the minimum, maximum, and range of prices they discovered and also used this data to develop a national average price for each item. We then discussed serving size and used this concept to help students find out answers to questions such as, “what is the cost of a single hotdog and bun?”
The Power of Data Analysis
To bring this process to a close we used the power of data analysis to engage in a group discussion around more challenging questions such as:
- What is the overall average cost of materials of a meal?
- What is the overall average minimum cost of materials of a meal?
- What is the overall average maximum cost of materials of a meal?
Reflecting upon this process Jeri and I were amazed at how students will leap into very complex mathematical analysis when they are motivated to learn the answers and when the subject matter is concrete and relevant. We were also humbled by how the group came together to both teach and learn from each other. Finally, we were fascinated by the distributed leadership that emerged as students both supported each other’s ideas when needed and let go of their own agendas for the good of a larger common goal.
If you want to support this kind of rich, student-driven work, please sign up for the 5th and 6th grade Friday lunch sales!